Arithmetic Average: developing conceptual understanding
Many pupils are taught how to calculate the arithmetic average (the mean.) They are also taught a shallow understanding of the concept: it goes along the lines of “the mean is a calculated ‘central’ value of a set of numbers.” Or pupils have a very loose understanding of ‘average’ as colloquially referred to as ‘on average’. This is a start, but can an instructional programme be created to teach a deeper concept of the mean, accessible even to young pupils (8-14)?
I believe it can.
If so, it will aid future understanding of the weighted average at GCSE level.
Furthermore, it will lay the groundwork to understand how the trapezium rule approximates the area beneath a curve, at A Level.
I’m going to cover:
- Properties of the mean
- Selecting which properties to teach
- How to teach them
- Why it’s important
Fundamental properties of the mean
In Strauss and Efraim (1988) seven properties of average are outlined and these properties were chosen to be discussed because “they are fundamental, and tap into three aspects of the concept”.
I’m going to discuss what I think are the five most important.
Property 1: The average is always located between the extreme values
The average value of a set of data cannot be smaller than the minimum value or larger than the maximum value of the said data set.
This seems like common sense to an adult but expertise induced blindness underestimates the difficulty for pupils to understand this property of the mean.
How can this be communicated to pupils?
By example, show that the average value is never smaller than the minimum value or larger than the maximum value.
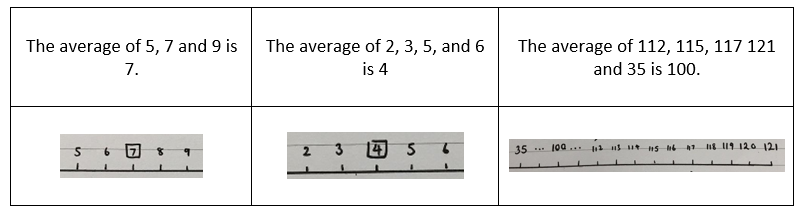
Then, test pupils’ understanding of the property using the following type of question:
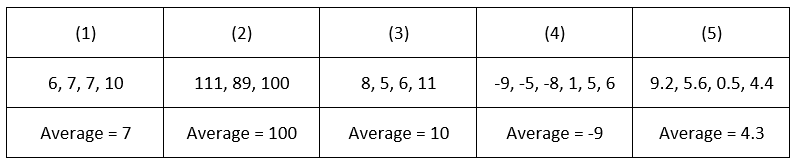
For each question the average value could be true or definitely false, state whether the average value is true or false for the corresponding data set:
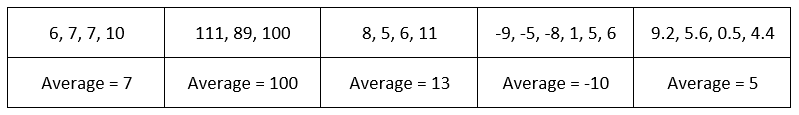
The following true or false questions are testing a pupil’s understanding of the property rather than their procedural knowledge of calculating the mean.
Property 2: The average is representative of the values that were averaged.
More technically: “the average is the value that is closest to all of the others in the set of values that are being averaged.”
Therefore, the average value represents all the values within the data set.
This property ties in nicely with the third property.
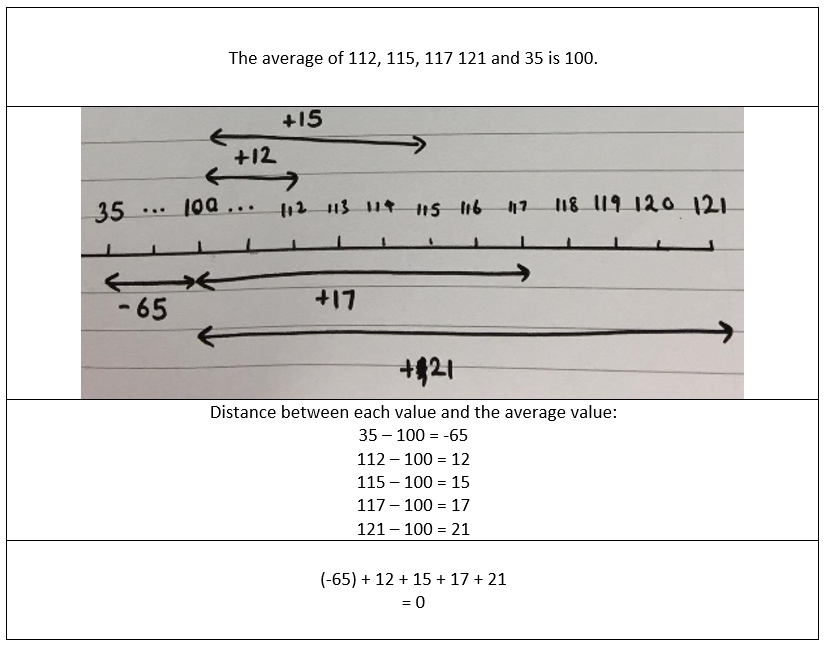
Property 3: The sum of the deviations from the average is 0.
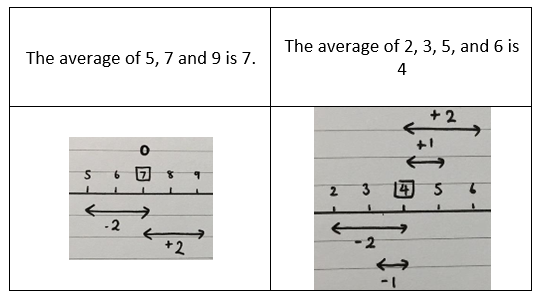
Each value in the data set is a certain distance away from the average value which is clearly understood from a visual example. If we total the distances between each value and the average value, that total will equal to 0. This helps pupils to visualise that the average value is central to all the values. This highlights that the concept of the average value is again the central value to values within the data set. Furthermore, this highlights that the average value represents all the values that were averaged (property 2).
How do we communicate this to pupils?
- Outline how to find the distance between each value and the average value.
- Emphasise that I do (value – average value) and that the distance can be negative, if the value is smaller than the average value. However, the pupils need to picture the distances.
- Total the distances, also tell pupils that we call this sum the sum of deviations
There are two questions that can be asked to develop understanding around property 3:
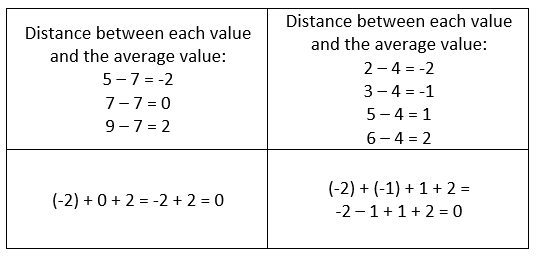
- Show for each data set that the sum of the deviations from the average is 0 (Qs 1 – 3 only)
- For each set of data, the average value is either true or false. Determine which of the following average values for the corresponding data set are true or false using your knowledge of the following property:
The sum of the deviations from the average is 0.
The first question is asking pupils to apply their knowledge of finding the sum of the deviations for the average value. The second question is asking pupils to apply this knowledge but then decide which of the following data sets has the correct average value.
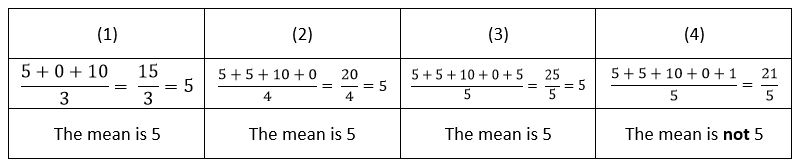
Property 4: When one calculates the average, a value of 0, if it appears, must be taken into account.
Dylan Wiliam has an excellent hinge question that deals with this property very well.
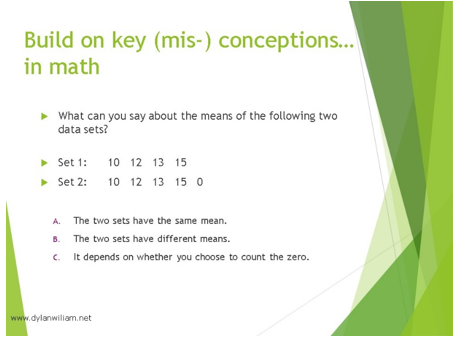
Pupils often think they don’t have to include a 0 value when calculating the mean.
A good way to overcome this is to simply include it in one of your examples.
Seeing this in a concrete context also allows pupils to see why 0 must be included as a value in the data set.
Concrete context:
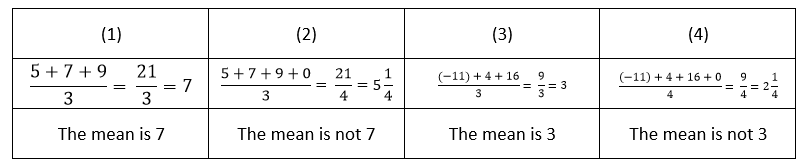
Sarah collected some money from her three siblings to raise money for charity. Hannah donated £5. Adam donated £7. Clare donated £9. Sarah did not donate any money. What was the average amount of money each of her siblings and Sarah donated?
Property 5: The average is only influenced by values other than the average.
This is a really nice point to make about arithmetic average:
Adding a value to a data set which is equal to the average value of the current data set does not influence the new average.
Why not?
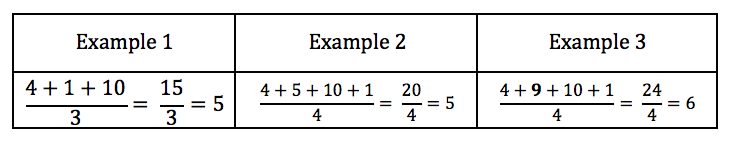
Because when we add a value that is the previous average, the resulting sum is divisible by the new denominator. How can we communicate this to pupils?
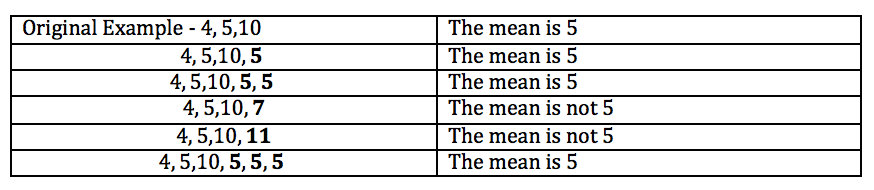
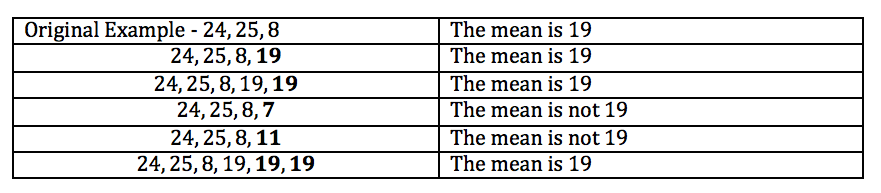
The worked examples above show how the mean does not change when you add the average value of the previous data set (going from example 1 – 2 and 2 – 3). The last example shows that the mean does change when a value which is not the average of the previous data set is added.
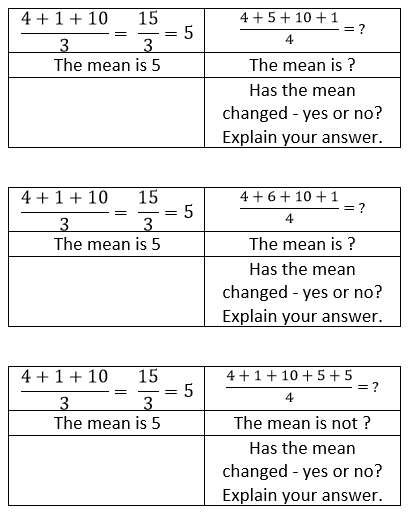
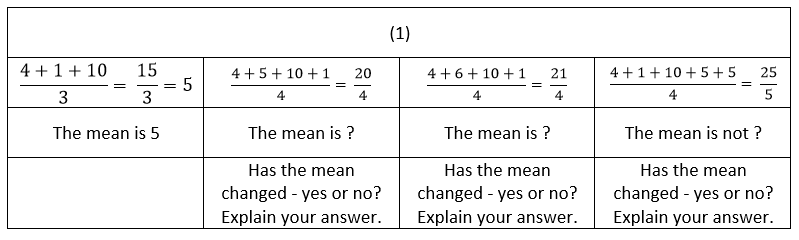
To communicate this I would ask pupils to determine if the number added would change the average value. For example, the question series is designed for pupils to do the following
- calculate the average for each data set
- Decide if the mean has changed by adding a value.
- Explain that we have added a value which is equal to the average value. Adding the average value does not influence the values being averaged.
At the end, I would explain how when we add the average value to the data set (5), we get a sum which is divisible by the denominator (20/4 = 5). When we add a value that is not the previous average, the resulting sum is not divisible by the new denominator.
In summary, these properties of arithmetic average can be taught effectively with the correct worked examples and problem exercises which communicate each property at one time. It gives pupils a spatial understanding of the mean which is above and beyond the procedural calculation of calculating the mean. I think it is highly powerful knowledge that can lend itself for more complex understanding of the mean when learning about the difference between simple mean and weighted average mean.
Recent Comments